Mailbox Analytics gives you a detailed view of how each mailbox is performing, who you’re sending to, how recipients are responding, and where potential deliverability issues may be occurring.
To view analytics for a mailbox:
Open Primeforge.
Select the mailbox you want to analyze.
Open the Analytics section.
You’ll find two analytics views:
Activity & Health
Recipients & Bounced
You can also change the reporting period to 24h, 7d, 30d, 90d, Year, or All time.
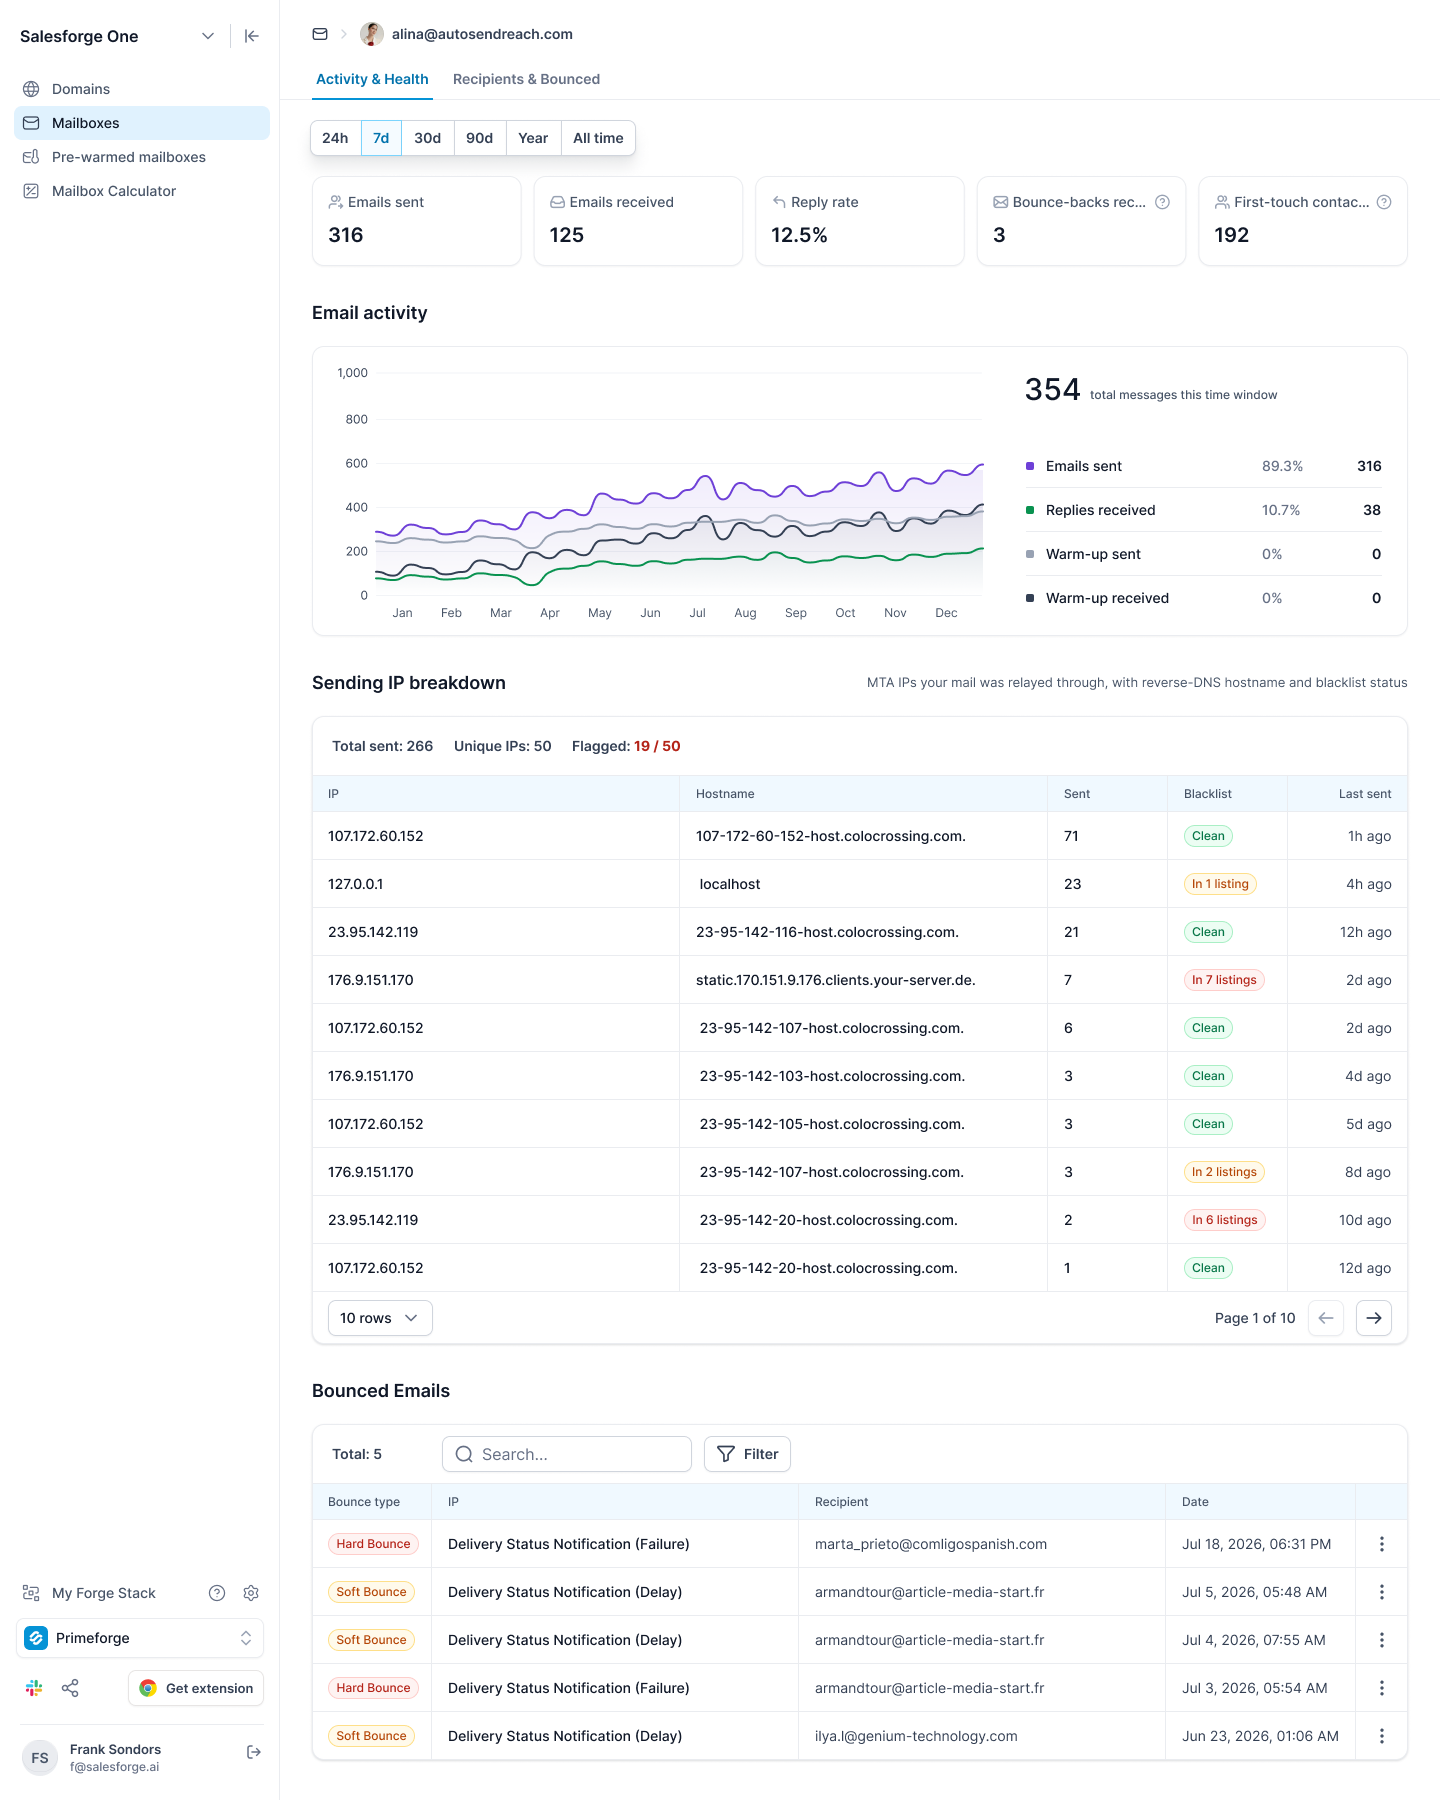
The Activity & Health view provides an overview of your mailbox's sending and receiving activity.
You can see:
Emails sent — Total number of emails sent during the selected period.
Emails received — Total incoming emails received by the mailbox.
Reply rate — Percentage of sent emails that resulted in a reply.
Bounce-backs received — Number of bounce notifications received.
First-touch contacts — Contacts receiving their first email from the mailbox.
The activity chart lets you track mailbox activity across the selected time period, including:
Sent emails
Replies
Warm-up activity
This makes it easier to identify changes in sending volume, engagement, or warm-up activity over time.
Primeforge also provides visibility into the sending infrastructure associated with the mailbox.
For each sending IP, you can view:
Hostname
Sending volume
Blacklist status
Last activity
This can help you identify which IPs are handling your sending activity and quickly spot potential infrastructure or reputation issues.
The Bounced Emails section provides a detailed overview of emails that were not successfully delivered.
You can:
View bounced emails
Search for specific bounces
Filter bounce results
Distinguish between hard bounces and soft bounces
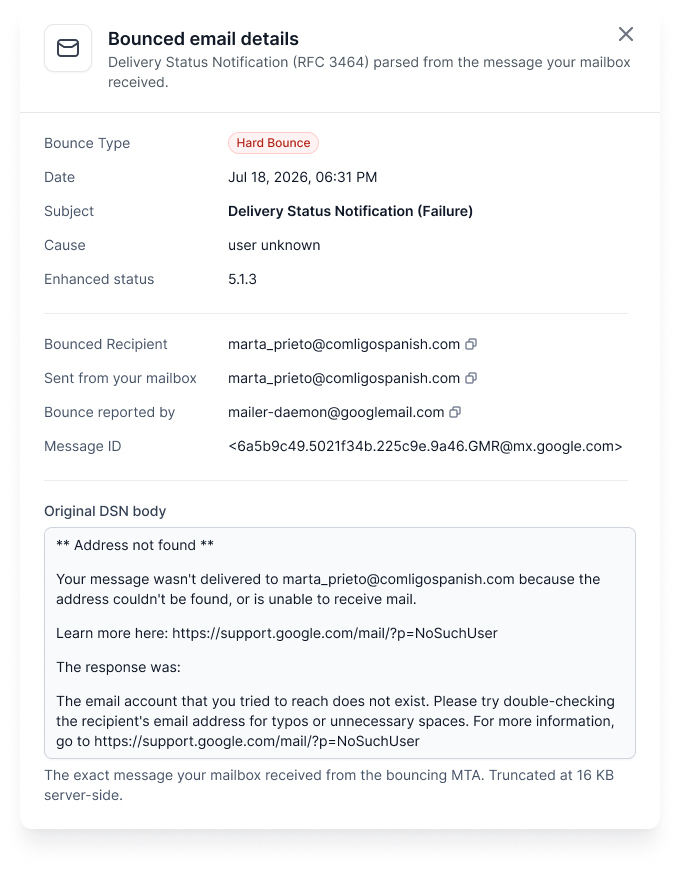
Clicking on an individual bounce provides additional delivery information, including:
Bounce cause
Enhanced status
Reporting MTA
Message ID
Original DSN response
This information can be particularly useful when troubleshooting delivery failures and determining why a recipient server rejected or deferred an email.
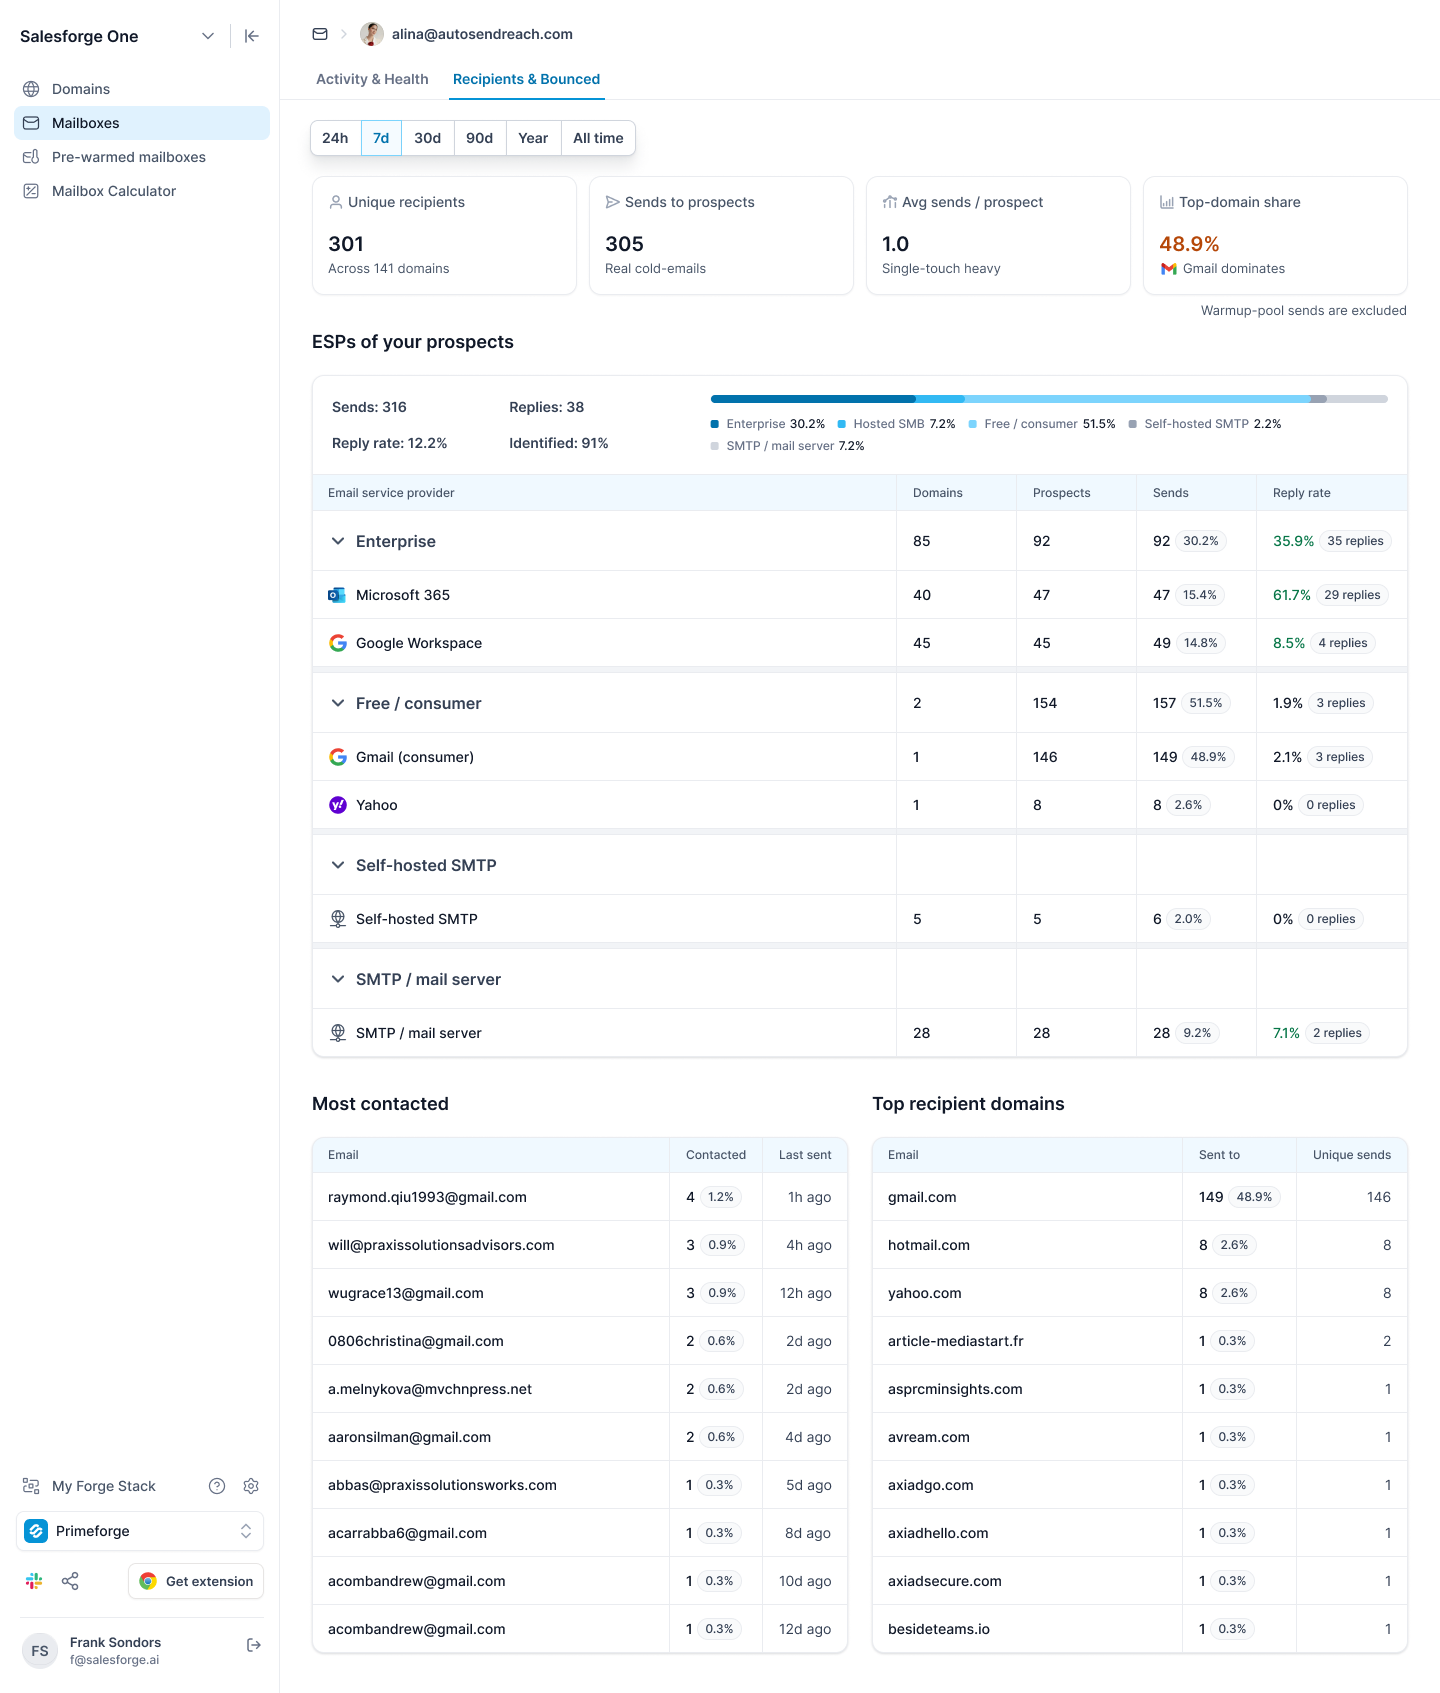
The Recipients & Bounced view provides insight into your recipient base and sending patterns.
You can see:
Unique recipients — Number of distinct recipients contacted.
Sends to prospects — Total sends made to prospects.
Average sends per prospect — Average number of emails sent to each prospect.
Top-domain share — Share of your recipient activity concentrated among the most common domains.
Primeforge breaks down your prospects based on their email provider or ESP.
This includes:
Microsoft 365
Google Workspace
Consumer email providers
Self-hosted mail servers
You can also see reply rates by provider, helping you understand how engagement differs across recipient platforms.
The analytics view highlights your most contacted recipients, allowing you to quickly identify recipients who have received the highest number of emails from the mailbox.
You can also view top recipient domains to understand which domains make up the largest portion of your outbound activity.
Mailbox Analytics supports multiple reporting periods so you can analyze mailbox performance at different levels:
24h — Recent activity
7d — Weekly performance
30d — Monthly performance
90d — Quarterly performance
Year — Year-to-date activity
All time — Complete mailbox history
Switch between time periods to compare recent performance with longer-term trends.
Mailbox Analytics gives you a clearer picture of your mailbox performance in one place.
You can use it to:
Monitor sending and receiving activity
Track replies and engagement
Identify hard and soft bounces
Investigate individual delivery failures
Monitor sending IP activity and blacklist status
Understand who you're sending to
See which email providers your prospects use
Compare reply rates across providers
Identify your most contacted recipients
Analyze mailbox activity over different time periods
With these insights, you can more easily understand how each mailbox is being used, where your emails are going, how recipients are responding, and where deliverability problems may be occurring.